Quick Reference: Draw Completion Probabilities in Hold’em
Find your draw and choose the column for the next card or both remaining cards. The figures below assume that only your two hole cards and the board are known. Outs are the cards that complete the draw. [3]
| Draw | Outs | Flop → turn | Turn → river* | Flop → river |
|---|---|---|---|---|
| Gutshot straight draw | 4 | 8.51% | 8.70% | 16.47% |
| Open-ended straight draw | 8 | 17.02% | 17.39% | 31.45% |
| Flush draw | 9 | 19.15% | 19.57% | 34.97% |
*For the turn-to-river column, the turn missed the draw and the number of outs remains unchanged. The flop-to-river column counts hitting at least one of the outs over both cards. Percentages are rounded to two decimal places. [3]
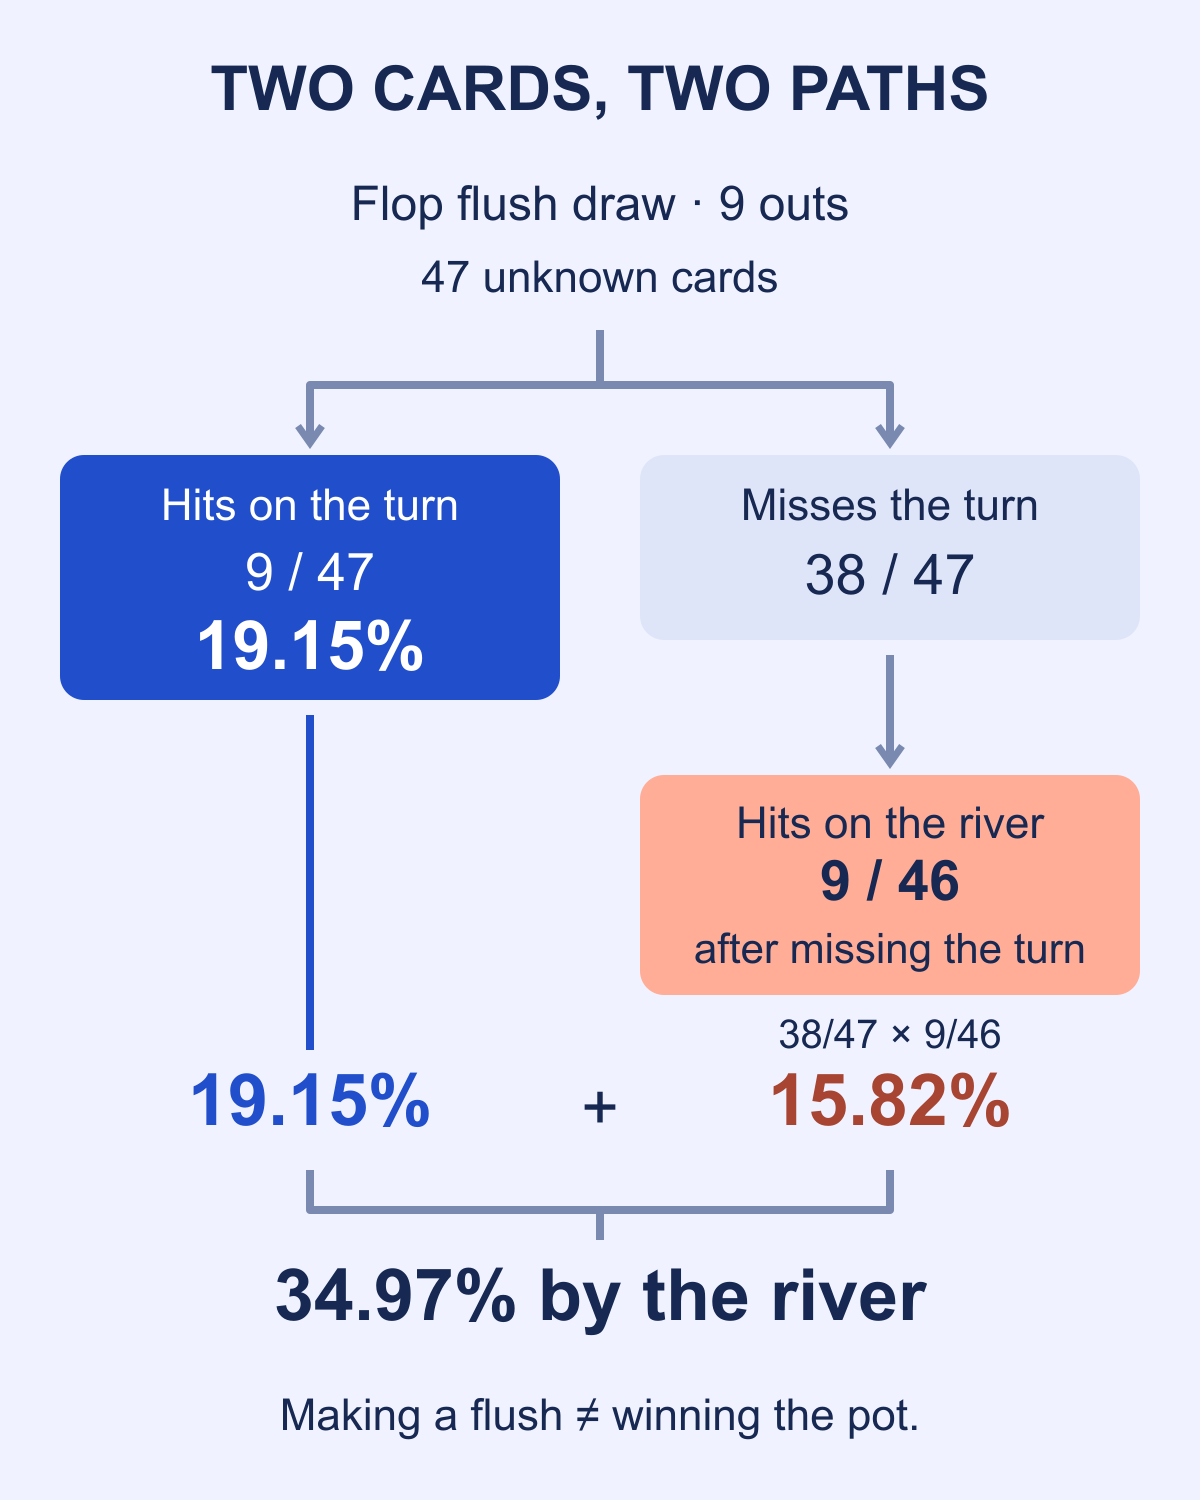
With a flush draw, you can already see four cards of one suit; nine of that suit’s thirteen cards remain to complete the flush. [1] The diagram separates the two paths: hitting on the turn, or missing the turn and hitting on the river. Adding these paths avoids counting hands that hit on both cards twice.
How to Calculate: One Card or Two
After the flop, you know five cards and 47 are unknown; after the turn, six are known and 46 are unknown. Some unknown cards may be in opponents’ hands. For the next card, divide the outs by that total: 9 ÷ 47 ≈ 19.15% on the flop, or 9 ÷ 46 ≈ 19.57% on the turn if the draw has not completed. [3]
With two cards to come, calculate the chance of missing both and subtract it from 1. For the same nine outs: 1 − (38 ÷ 47 × 37 ÷ 46) ≈ 34.97%. This gives the flop-to-river column. [3]
Without the chart, multiply the outs by 2 to estimate the next card or by 4 for both cards. For nine outs, 9 × 4 = 36%, about one percentage point above the exact figure. This is an approximation: with fifteen outs, the rule of 4 overestimates by 5.9 percentage points. [3]
Some charts show ratios, such as “1.9 to 1,” instead of percentages. To convert, divide 100 by the percentage and subtract 1 [2]. Applying this calculation to the two-card figure for the flush draw (flop to river), 100 ÷ 34.97 gives about 2.86, and 2.86 − 1 gives 1.86, which the draw chart rounds to 1.9 to 1 in the flush draw row [3]. The ratio and percentage describe the same event from different angles: the ratio indicates how many times the draw fails to complete for each time it completes.
Limits: What Each Probability Chart Leaves Unanswered
Not every chart with percentages measures the same thing. This table separates four common types found in Hold’em materials and shows what each counts and what it does not answer.
| Chart type | What forms the denominator | Scope of the reading | What it does not answer |
|---|---|---|---|
| Starting hands | The two-card hands you can be dealt [1] | What you receive before the flop | The chance of completing a draw |
| Final hand categories | Complete seven-card deals: two hole cards and five community cards [1] | Theoretical frequency of the final category in those deals | Observed frequency of hands actually played through to the river; probability conditional on a specific flop |
| Completing a draw | One card to come: the 47 unknown cards on the flop or the 46 on the turn. Two cards to come: the turn-and-river combinations [3] | Depends on the outs and whether one or two cards are to come | Whether the completed hand is ahead |
| Preflop matchup | The possible combinations of five community cards after the two hands shown [3] | Exact hands and suits, with ties split | Other hands or other suits |
- The chance of completing a draw is not the chance of winning the pot. [3]
- Before using the two-card probability to assess the price of a call, check whether you will have to pay again to see the river. [2][3]
Examples: The Same Hand Name, Different Questions
The three cases below use figures from the charts to show how the event and the set of outcomes change the reading.
A Straight as a Draw and as a Final Hand Category
The 31.45% in the first chart starts with an eight-out open-ended draw on the flop. The 4.62% frequency of a straight as the final category counts all seven-card deals, not just those that had this draw. The conditions differ. [1][3] To compare the strength of hand categories, see the poker hand rankings.
Counting Outs: When the Totals Do Not Add Up
| Situation | Outs in the chart |
|---|---|
| Gutshot | 4 |
| Open-ended straight draw | 8 |
| Flush draw | 9 |
| Flush draw with a gutshot | 12 |
| Flush draw with an open-ended straight draw | 15 |
| Pocket pair to a set | 2 |
These counts appear in [3] and, for gutshots, open-ended straight draws, flush draws, and flush draws with open-ended straight draws, also in [2]. The combined totals are not simple sums: 9 + 4 would be 13, but the chart lists 12 for a flush draw with a gutshot; 9 + 8 would be 17, while the list gives 15 for a flush draw with an open-ended straight draw [3]. The difference comes from cards that serve both draws and can only be counted once. Overestimating outs distorts every reading that follows.
Starting Hands: A Denominator Without Cards to Come
Before the flop, the starting-hand chart measures how often you are dealt a particular type of hand: a pocket pair 5.9% of the time and a pair of aces 0.45% of the time [1]. The denominator is the set of two-card hands you can be dealt; nothing there refers to cards to come or draws, which is why these figures do not belong in the outs columns. The events can also overlap: aces are included among pocket pairs, and ace-king (1.2%) is included in “at least one ace” (15%) [1].
Using the Chart in Your Next Hand
Identify the draw, count its outs without duplication, and choose the column for the street. If you want to assess which hands an opponent may hold, the article on poker hand ranges connects position, stack size, and actions.
Recommended reading
- How to Calculate Pot Odds in Texas Hold’em: A Practical Guide to Calling or Folding
- Poker Hand Rankings: From Strongest to Weakest
- Poker Hand Ranges: Reading and Making Decisions in Context

 1 day ago